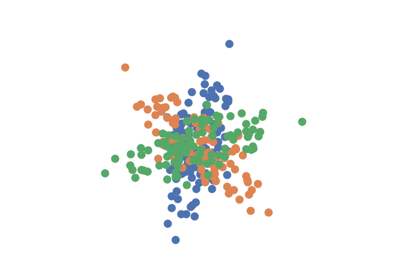
MANOVA
-
class
hyppo.ksample.MANOVA¶ Multivariate analysis of variance (MANOVA) test statistic and p-value.
MANOVA is the current standard for multivariate k-sample testing. The test statistic is formulated as below [1]:
In MANOVA, we are testing if the mean vectors of each of the k-samples are the same. Define \(\{ {x_1}_i \stackrel{iid}{\sim} F_{X_1},\ i = 1, ..., n_1 \}\), \(\{ {x_2}_j \stackrel{iid}{\sim} F_{X_2},\ j = 1, ..., n_2 \}\), ... as k groups of samples deriving from different a multivariate Gaussian distribution with the same dimensionality and same covariance matrix. That is, the null and alternate hypotheses are,
\[\begin{split}H_0 &: \mu_1 = \mu_2 = \cdots = \mu_k, \\ H_A &: \exists \ j \neq j' \text{ s.t. } \mu_j \neq \mu_{j'}\end{split}\]Let \(\bar{x}_{i \cdot}\) refer to the columnwise means of \(x_i\); that is, \(\bar{x}_{i \cdot} = (1/n_i) \sum_{j=1}^{n_i} x_{ij}\). The pooled sample covariance of each group, \(W\), is
\[W = \sum_{i=1}^k \sum_{j=1}^{n_i} (x_{ij} - \bar{x}_{i\cdot} (x_{ij} - \bar{x}_{i\cdot})^T\]Next, define \(B\) as the sample covariance matrix of the means. If \(n = \sum_{i=1}^k n_i\) and the grand mean is \(\bar{x}_{\cdot \cdot} = (1/n) \sum_{i=1}^k \sum_{j=1}^{n} x_{ij}\),
\[B = \sum_{i=1}^k n_i (\bar{x}_{i \cdot} - \bar{x}_{\cdot \cdot}) (\bar{x}_{i \cdot} - \bar{x}_{\cdot \cdot})^T\]Some of the most common statistics used when performing MANOVA include the Wilks' Lambda, the Lawley-Hotelling trace, Roy's greatest root, and Pillai-Bartlett trace (PBT) [3] [4] (PBT was chosen to be the best of these as it is the most conservative [5] [6]) and [7] has shown that there are minimal differences in statistical power among these statistics. Let \(\lambda_1, \lambda_2, \ldots, \lambda_s\) refer to the eigenvalues of \(W^{-1} B\). Here \(s = \min(\nu_{B}, p)\) is the minimum between the degrees of freedom of \(B\), \(\nu_{B}\) and \(p\). So, the PBT MANOVA test statistic can be written as [8],
\[\mathrm{MANOVA}_{n_1, \ldots, n_k} (x, y) = \sum_{i=1}^s \frac{\lambda_i}{1 + \lambda_i} = \mathrm{tr} (B (B + W)^{-1})\]The p-value analytically by using the F statitic. In the case of PBT, given \(m = (|p - \nu_{B}| - 1) / 2\) and \(r = (\nu_{W} - p - 1) / 2\), this is [2]:
\[F_{s(2m + s + 1), s(2r + s + 1)} = \frac{(2r + s + 1) \mathrm{MANOVA}_{n_1, n_2} (x, y)}{(2m + s + 1) (s - \mathrm{MANOVA}_{n_1, n_2} (x, y))}\]
Methods Summary
|
Calulates the MANOVA test statistic. |
|
Calculates the MANOVA test statistic and p-value. |
-
MANOVA.statistic(*args)¶ Calulates the MANOVA test statistic.
- Parameters
*args (
ndarray) -- Variable length input data matrices. All inputs must have the same number of dimensions. That is, the shapes must be (n, p) and (m, p), ... where n, m, ... are the number of samples and p is the number of dimensions.- Returns
stat (
float) -- The computed MANOVA statistic.
-
MANOVA.test(*args)¶ Calculates the MANOVA test statistic and p-value.
- Parameters
*args (
ndarray) -- Variable length input data matrices. All inputs must have the same number of dimensions. That is, the shapes must be (n, p) and (m, p), ... where n, m, ... are the number of samples and p is the number of dimensions.- Returns
Examples
>>> import numpy as np
>>> from hyppo.ksample import MANOVA
>>> x = np.arange(7)
>>> y = x
>>> stat, pvalue = MANOVA().test(x, y)
>>> '%.3f, %.1f' % (stat, pvalue)
'0.000, 1.0'
